Are Your Customers Lost? Using Heat Maps to Find Out Where the Heck They're Going
Let's be honest. You’ve spent countless hours arranging your store. You’ve agonized over the placement of that new line of artisanal goat milk soap. You’ve created a promotional display so beautiful it could bring a tear to a stoic’s eye. And yet, some parts of your store remain a veritable retail desert, a place where products go to gather dust and contemplate their existence. You think you know the path your customers take, but is that just a gut feeling fueled by caffeine and wishful thinking?
What if you could see your store through your customers' eyes? Not in a creepy, "I'm watching you from the security office" way, but in an aggregate, data-driven, "Aha! So that's why no one is buying the goat milk soap" way. Welcome to the world of in-store heat-mapping technology. It’s the closest thing we have to a crystal ball for retail, showing you precisely where shoppers wander, where they linger, and where they run for the hills. It's time to stop guessing and start knowing.
Decoding the Customer Maze: What Heat Maps Actually Tell You
At its core, a heat map is a visual representation of data. In your store, it overlays a floor plan with colors that show customer activity. Bright red and orange areas are “hot spots” buzzing with traffic, while cool blue and green areas are “cold spots” that customers are actively avoiding. It's like a weather map for shopper behavior, and it’s about to become your new favorite tool.
Identifying Hot Spots, Cold Spots, and the 'Lukewarm Middle'
The first thing you’ll notice is the obvious: the entrance is red hot. But what about the less obvious? That expensive end-cap you set up—is it a blazing inferno of customer interest or an arctic wasteland? Heat maps give you the unvarnished truth.
- Hot Spots: These are your gold mines. They're the high-traffic zones where you should place your high-margin items, new arrivals, and impulse buys. This is where your best products get the attention they deserve.
- Cold Spots: These are your problem children. Is it a poorly lit corner? A dead-end aisle? Use this data to diagnose the issue. You can either try to revitalize these areas with new lighting or a killer display, or you can relegate them to housing staple items that customers will actively seek out anyway (like, you guessed it, the milk at the back of the store).
By understanding this basic thermal dynamic, you can start making simple changes that guide customers toward the products you want them to see, dramatically influencing their path to purchase.
Uncovering the "Butt-Brush" Effect and Other Awkward Truths
Famed retail anthropologist Paco Underhill coined the term “butt-brush effect” to describe a simple phenomenon: when a shopper is bumped from behind, they are very likely to abandon what they’re doing and leave the aisle. We’re all a little protective of our personal space, especially when we’re trying to decide between two very similar shades of beige paint.
Your heat map is brutally honest about these cramped quarters. If you see an aisle full of fantastic products that is consistently blue, the problem might not be the merchandise. The aisle itself might just be too darn narrow. Shoppers are subconsciously avoiding it to prevent an awkward encounter. The data gives you the justification you need to widen that aisle, even if it means sacrificing a smidge of shelf space. A comfortable shopper is a browsing shopper, and a browsing shopper is a buying shopper.
Tracking the Customer Journey (Not in a Creepy Way)
Do 90% of your customers immediately turn right upon entering? Do they make a beeline for the clearance section before going anywhere else? Heat maps reveal these well-trodden paths, showing you the "superhighways" of your store layout. This isn't about tracking individuals; it's about understanding the collective flow.
Once you know the route, you can become a master of strategic product placement. If everyone passes the sock display on their way to the shoes, why not add some premium shoe-cleaning kits right next to it? It’s about creating a logical journey that encourages discovery and cross-selling. Think of it as setting up a breadcrumb trail where the breadcrumbs are irresistible products that lead straight to a fuller shopping cart.
From Data to Dollars: Putting Insights into Action
Having a pretty color-coded map is nice, but it's useless if you don't act on it. The real magic happens when you use these insights to make strategic, data-backed decisions that directly impact your bottom line.
The Power of a Perfect First Impression
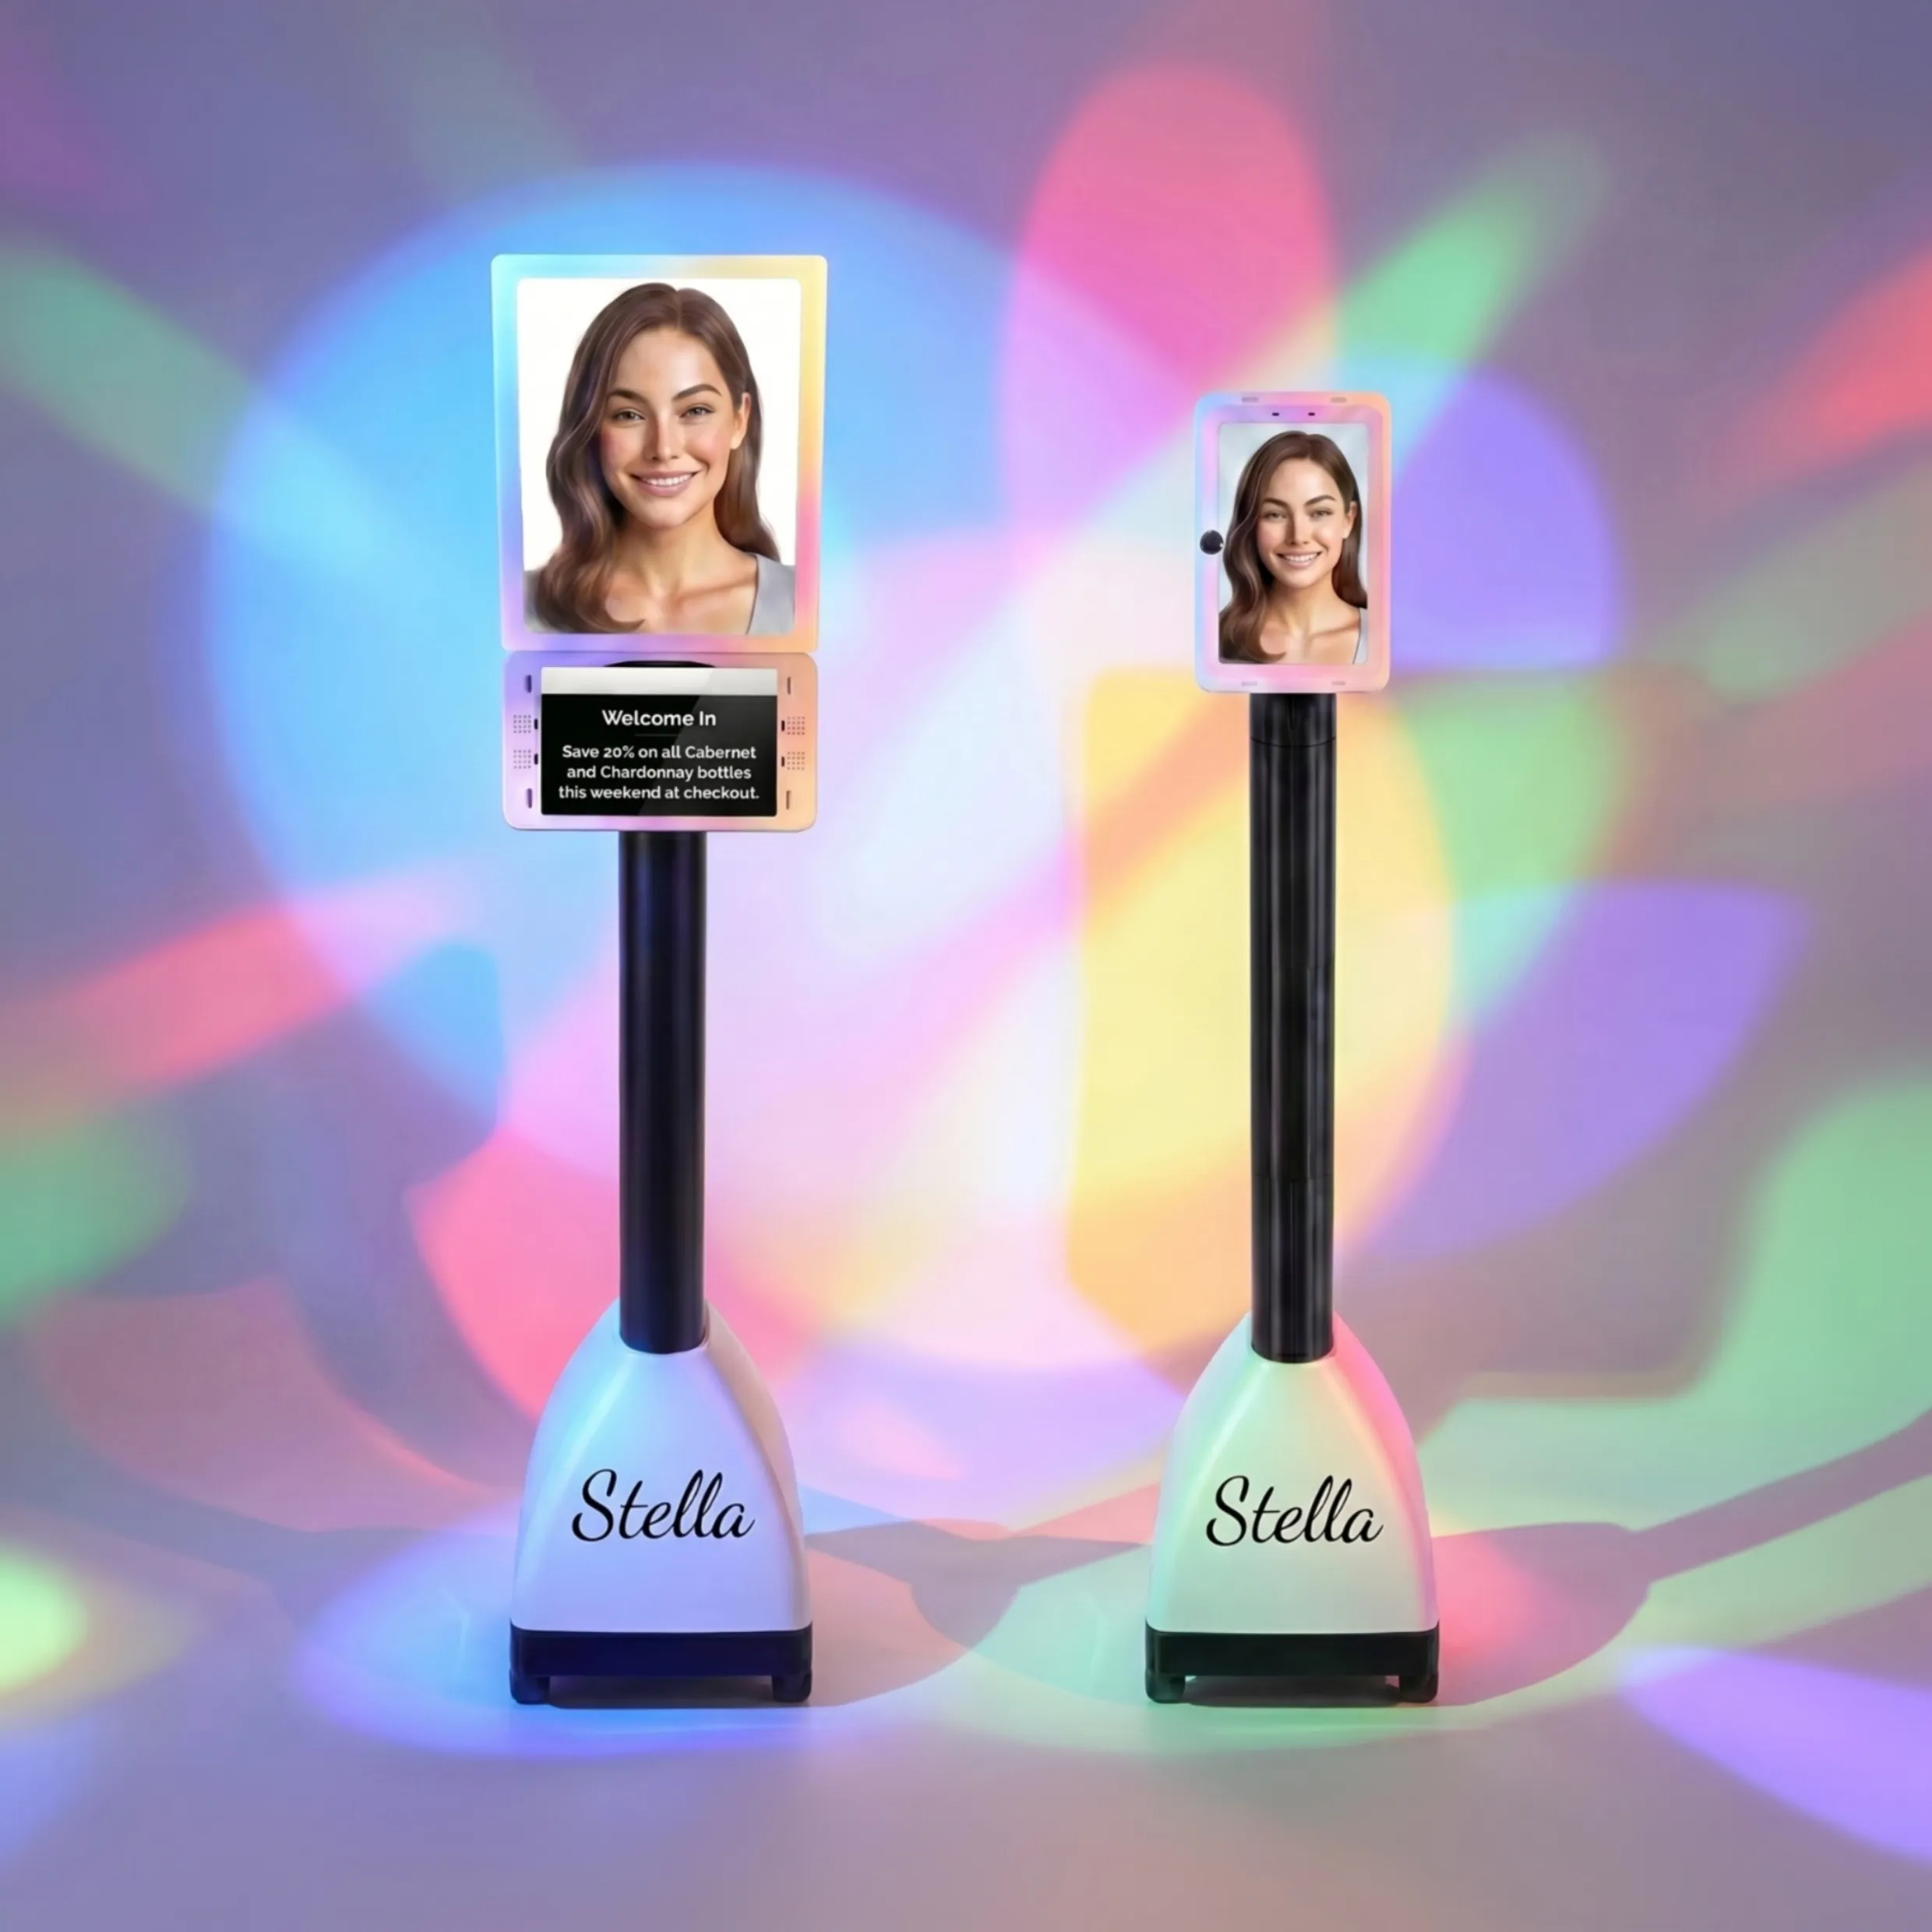
Your heat map will almost certainly show the "decompression zone"—the first 5 to 15 feet inside your entrance—as one of the hottest areas in your store. Customers pause here to get their bearings, and it’s your single best opportunity to make an impression. But what’s the right impression? While a heat map tells you where they stop, it can't tell you why. That's where a little help comes in handy. By placing an assistant like Stella in this high-traffic zone, you can turn a passive hot spot into an active engagement zone. She can greet every single customer, highlight the day's promotions, and even gather feedback on what offers are resonating. Suddenly, your hottest real estate isn't just a waiting area; it's a sales-generating, insight-collecting machine.
Testing, Tweaking, and Terrific Results
Optimization is not a one-time event. It’s a process. Use your heat maps to conduct A/B tests on your layout. For example:
- Run a heat map analysis for two weeks to establish a baseline.
- Move a key promotional display from a lukewarm area to a hotter one.
- Run the analysis for another two weeks and compare the results.
Did dwell time increase? Did sales for those products go up? This iterative process of testing, measuring, and tweaking is how you evolve from a store that works to a store that works brilliantly.
Beyond the Basics: Advanced Heat-Mapping Strategies
Once you’ve mastered the art of spotting hot and cold zones, you can start leveraging heat map data for even more sophisticated optimizations that will make your competitors wonder what your secret is.
Staffing Smarter, Not Harder
Is your checkout area a sea of angry red every day between 5:00 PM and 6:00 PM? That’s your heat map screaming, "For the love of all that is retail, schedule another cashier!" The data shows you precisely when and where your peak times occur, allowing you to optimize staffing schedules to meet demand. It also reveals where customers might be confused. A hot spot in a complex section like consumer electronics, paired with low sales for that area, is a huge red flag that shoppers need assistance. Stationing a knowledgeable employee there during peak times can turn that confusion into conversions.
Merchandising Like a Mastermind
You spent a week building a glorious pyramid of organic pasta that would make nonna proud. But is it moving product, or is it just an impressive carbohydrate-based sculpture? Heat maps provide objective, undeniable proof of a display’s performance. A study from Nielsen once found that well-placed displays can increase sales by over 500%. Heat maps are the tool that helps you find that perfect placement. Compare the traffic and dwell time before and after a merchandising change to calculate its exact return on investment. No more arguing over which display is "better"—the data will declare the winner.
Connecting In-Store Behavior to Sales Data
This is the holy grail of retail analytics. By overlaying your heat map data with your POS (Point of Sale) data, you can uncover incredibly powerful insights. Let's say your heat map shows a major hot spot right in front of your premium coffee selection—people are spending a lot of time there. But your sales data shows that the cheaper store brand is outselling it 10-to-1. What gives?
The heat map tells you that customers are interested in the premium coffee. The sales data tells you they aren't buying it. This is your cue to investigate. Is the pricing unclear? Is it placed on an inconveniently high or low shelf? Is the packaging confusing? You've just used data to identify a specific friction point in the customer journey that you otherwise never would have known existed.
A Quick Reminder About Stella
While you're becoming a master of customer flow and optimizing every last square foot, don't forget the first and most crucial touchpoint. Our AI retail assistant, Stella, stands ready at the entrance to ensure every shopper who walks through your door feels welcomed, informed, and ready to explore the amazing, data-driven layout you’ve created.
Conclusion: Stop Guessing, Start Selling
Your store’s layout is one of your most powerful—and most overlooked—sales tools. For too long, retailers have relied on instinct and old habits to design their spaces. Heat-mapping technology changes the game, replacing guesswork with concrete, actionable data that allows you to understand your customers on a whole new level.
By identifying hot and cold zones, understanding the natural customer journey, and optimizing your merchandising and staffing accordingly, you can create a shopping experience that is both more enjoyable for your customers and more profitable for you. So, take the first step. Research some heat-mapping solutions that fit your store and your budget. Your store is a silent salesperson; it's time to give it the data it needs to start shouting from the rooftops.