You Can't Improve What You Don't Measure (Especially When It's Walking Around Your Store)
Here's a fun thought experiment: imagine hiring a manager who never actually watches what happens on your sales floor. They set up the store, cross their fingers, and hope customers find what they need. Sounds absurd, right? And yet, a surprising number of brick-and-mortar business owners operate almost exactly that way — running on gut instinct, anecdotal observations, and the occasional "I think Tuesdays are slow" hypothesis.
The good news is that in-store analytics has matured significantly in recent years, giving even small and mid-sized retailers access to the kind of shopper behavior data that used to be reserved for big-box giants with enterprise budgets. Understanding how customers move through your space, where they linger, what they engage with, and when they abandon ship is no longer a luxury — it's a legitimate competitive advantage. And yes, it can meaningfully boost your sales without requiring you to completely rebuild your store from scratch.
In this post, we'll break down what in-store analytics actually looks like in practice, which metrics matter most, and how to turn shopper behavior data into smarter decisions that move the revenue needle.
Understanding the Fundamentals of In-Store Analytics
Before diving into strategy, it helps to understand what we're actually talking about when we say "in-store analytics." This isn't one tool — it's an ecosystem of data sources that, when combined, paint a remarkably detailed picture of your customer experience.
What In-Store Analytics Actually Measures
At its core, in-store analytics tracks how customers physically interact with your retail environment. This includes foot traffic counts (how many people walk in), dwell time (how long they stay in specific zones), traffic flow patterns (the paths they take through your store), conversion rates (what percentage of visitors actually buy something), and heat maps that show which areas attract the most attention — and which ones might as well be a storage closet.
Modern systems gather this data through a combination of tools: overhead cameras with computer vision, Bluetooth and Wi-Fi sensors that ping customer devices, point-of-sale integration, and even smart shelf technology. The result is a data-rich picture of shopper behavior that goes far beyond what your sales reports alone can tell you. Sales reports show you what sold. Analytics tell you why — and, more importantly, why some things didn't.
Key Metrics That Actually Matter
Not all analytics are created equal, and drowning in vanity metrics is a real occupational hazard. Here are the ones worth paying close attention to:
- Conversion Rate: The percentage of foot traffic that results in a purchase. Industry averages hover around 20–40% for specialty retail, so if you're well below that, your floor experience likely needs attention.
- Dwell Time by Zone: Areas where customers linger tend to be prime real estate for high-margin products and promotional displays.
- Bounce Rate: Yes, this concept applies offline too. It refers to customers who enter and leave almost immediately without engaging — often a sign of poor layout, unclear signage, or a first impression that isn't landing.
- Peak Traffic Windows: Knowing your busiest hours lets you schedule staff intelligently and time promotions for maximum impact.
- Basket Size vs. Traffic Volume: High traffic with low basket size often points to a merchandising or upselling opportunity hiding in plain sight.
Heat Maps and Traffic Flow: The Underrated Power Duo
If you've never looked at a store heat map, prepare to have some assumptions shattered. Most retailers assume customers naturally explore the whole store. In reality, shoppers are creatures of habit who follow fairly predictable paths — and many sections of your carefully curated floor may be getting far less attention than you think.
Heat map data lets you identify "cold zones" that might benefit from repositioning high-interest items or adding interactive signage to pull traffic deeper into the store. It also reveals your "power positions" — spots where almost every customer passes through — which are ideal for featuring new arrivals, seasonal promotions, or high-margin products. Retailers who actively use this kind of spatial data report measurable improvements in both average transaction value and overall conversion. A small change in product placement, backed by real data, can outperform weeks of social media campaigns.
How Technology (Including Stella) Can Amplify Your Analytics Efforts
Analytics tools are only as useful as the actions they inspire — and that's where having the right technology ecosystem in place makes a big difference. One increasingly practical addition for physical retail locations is an AI-powered in-store presence that both engages customers and generates useful behavioral data.
Turning Customer Interactions into Actionable Insight
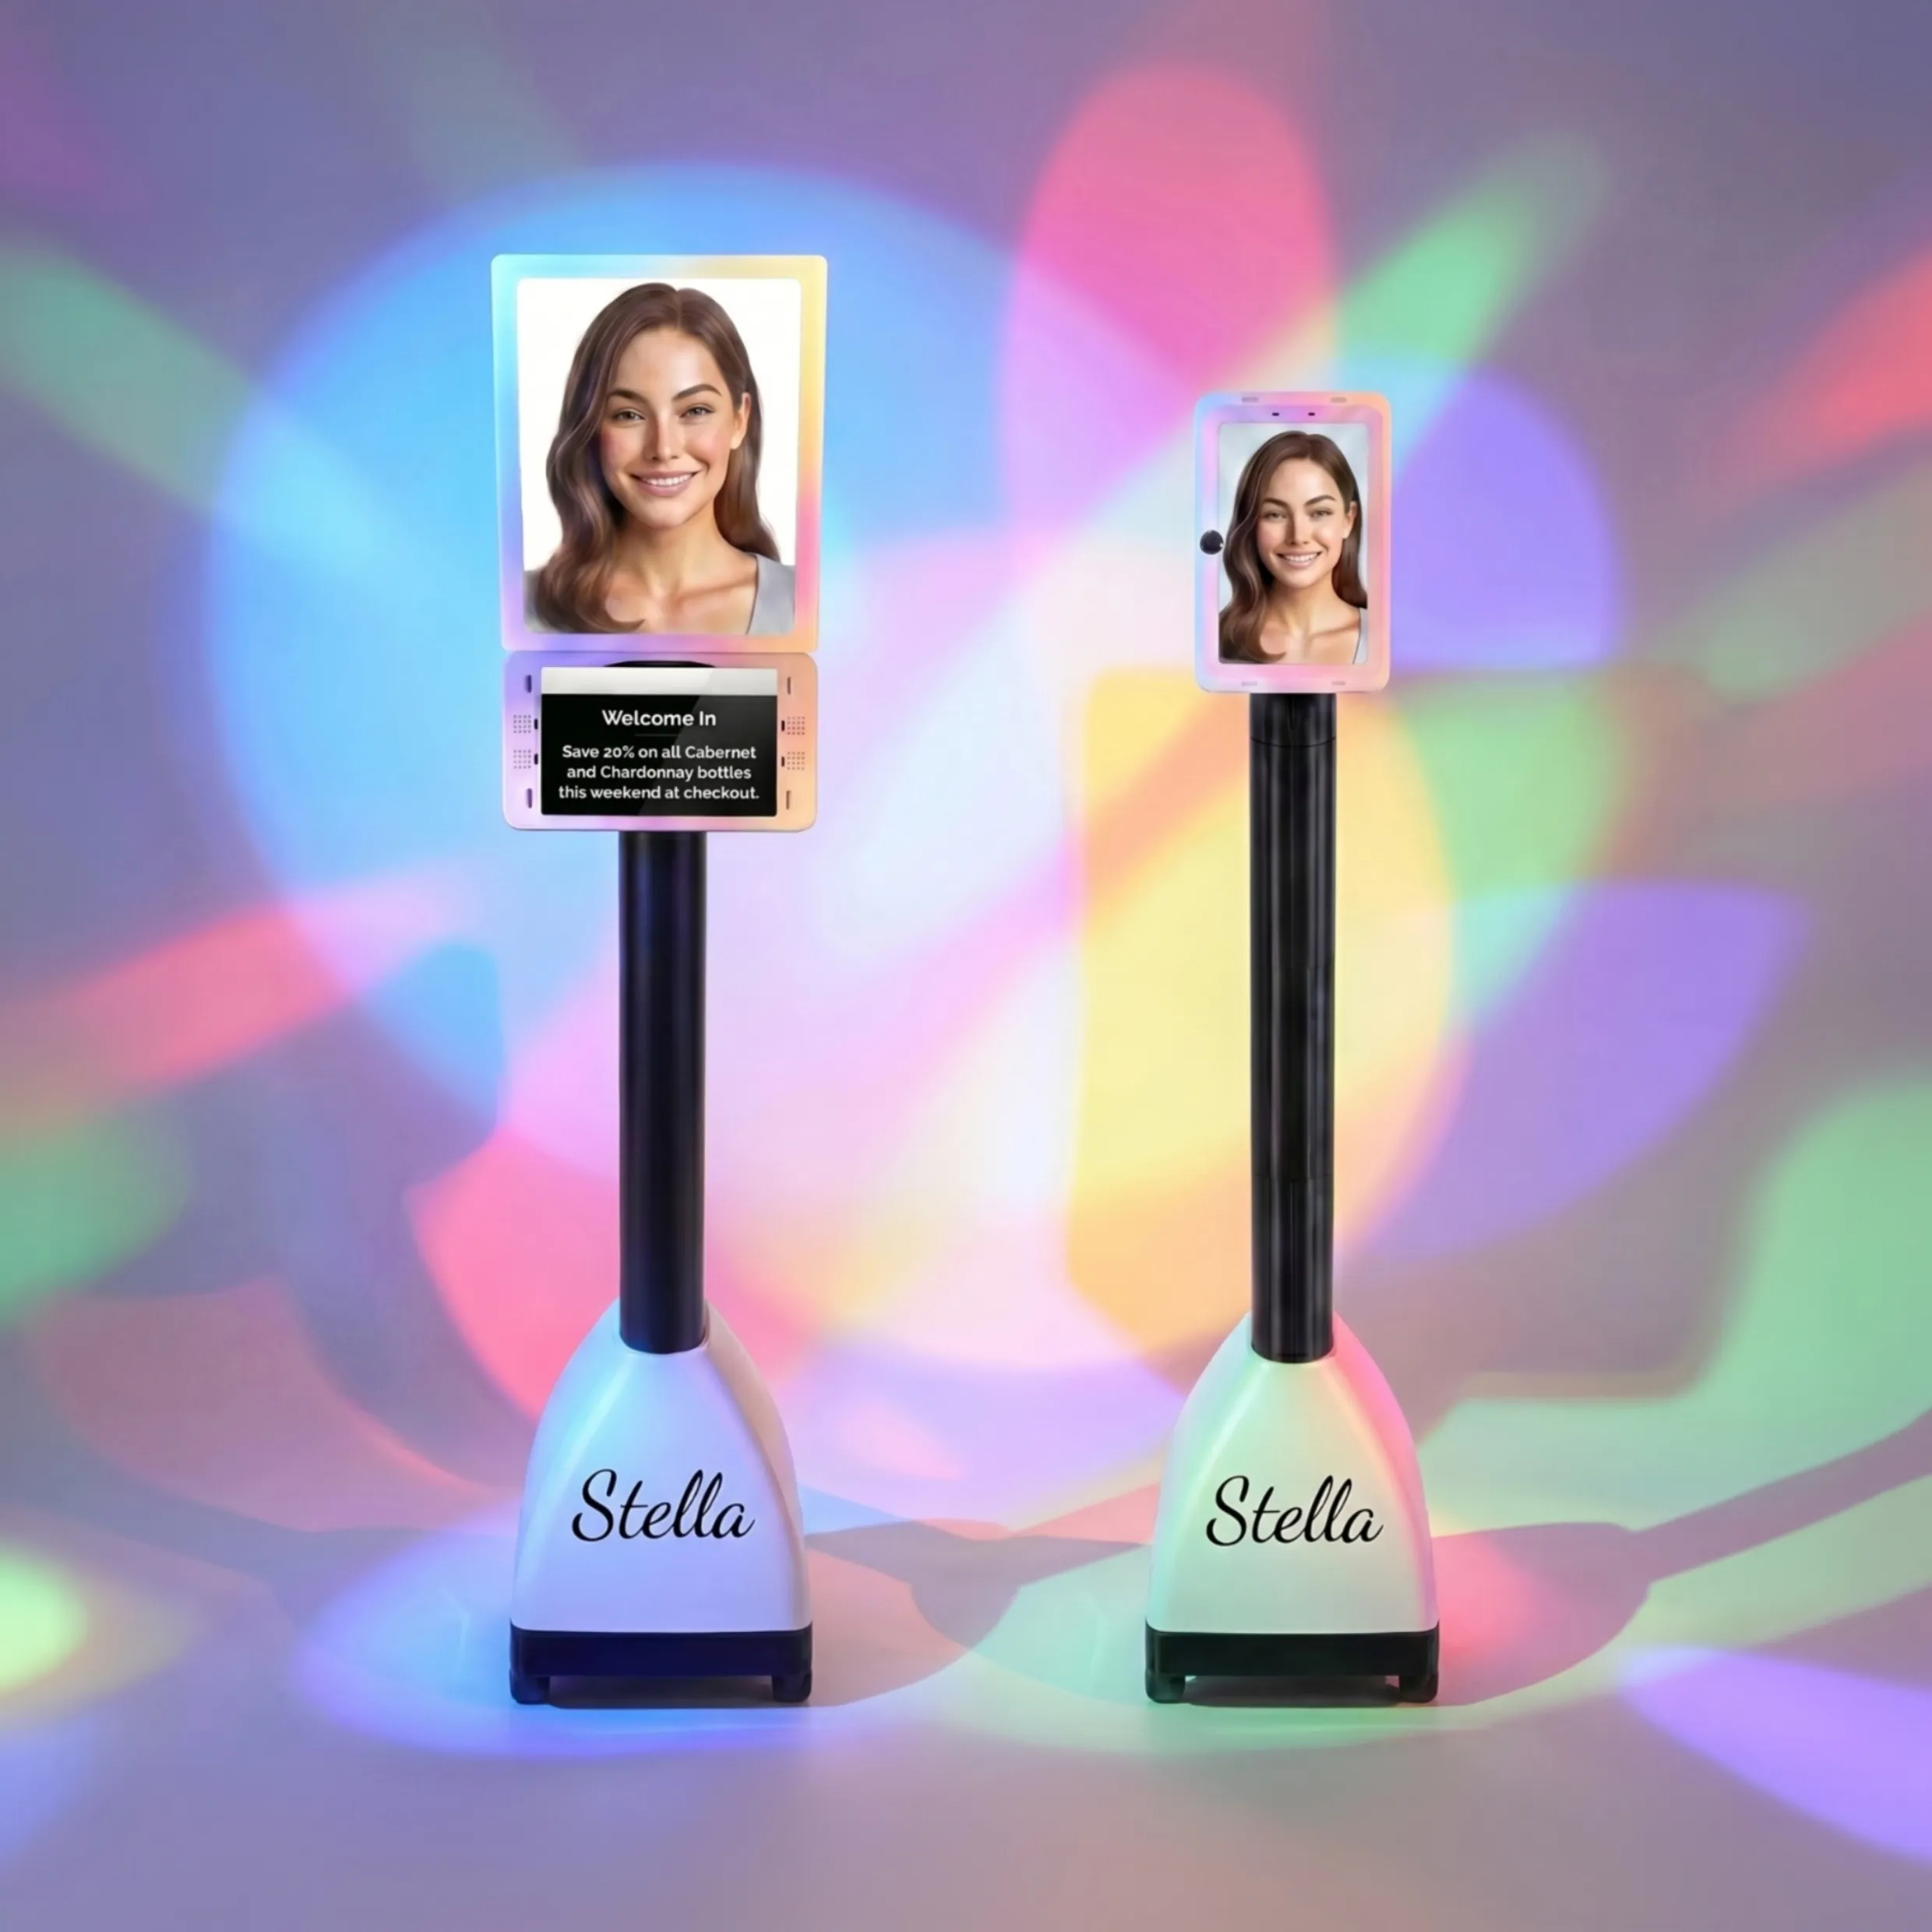
Stella, the AI robot employee and phone receptionist, does more than greet customers and answer questions at the kiosk — she also collects insights about customer interactions and promotional effectiveness. Every conversation is a data point: what customers are asking about, which promotions generate the most interest, what objections come up repeatedly, and where information gaps exist. That's a layer of qualitative insight that traditional foot traffic counters simply can't capture.
On the phone side, Stella answers calls 24/7 with the same business knowledge she uses in-store, handles intake forms conversationally, and manages contacts through a built-in CRM with custom fields, tags, and AI-generated profiles. For businesses trying to connect their in-store and phone touchpoints into a coherent customer picture, that kind of integrated data is genuinely valuable — and it runs on a straightforward $99/month subscription with no upfront hardware costs.
Turning Data into Smarter Store Decisions
Collecting data is step one. Knowing what to do with it is where most businesses either win or quietly give up and go back to gut instinct. Let's talk about the practical stuff.
Optimizing Store Layout Based on Traffic Patterns
Once you have a few weeks of heat map and traffic flow data, look for two things: where customers naturally gravitate, and where they almost never go. High-traffic zones near the entrance are perfect for impulse buys, seasonal displays, or limited-time promotions. Cold zones, rather than being abandoned, can often be revitalized by relocating a product category that generates curiosity or adding an interactive element that draws people in.
One popular strategy is the "decompression zone" adjustment — recognizing that the first few feet inside your entrance are essentially dead space where shoppers are still orienting themselves. Placing key promotions or featured products just past that zone, rather than right at the door, can meaningfully improve engagement. Retailers who have applied traffic data to layout optimization have reported conversion rate improvements of 10–15% without changing a single product in their inventory.
Using Dwell Time to Refine Merchandising and Staffing
Dwell time is a two-sided coin. High dwell in a product area generally signals strong interest — which means that's a great place to add complementary items for cross-selling, more detailed signage, or staff attention during peak hours. But high dwell combined with low conversion can indicate confusion, missing price tags, insufficient product information, or a layout that makes it hard to find what customers came for.
On the staffing side, aligning your team's schedule to peak traffic windows — rather than defaulting to uniform coverage — ensures your best people are on the floor when it counts. If analytics consistently show that Saturday afternoons between 1–4 PM drive 40% of your weekly conversions, that's not the time to be running on a skeleton crew.
Testing and Iterating with Promotional Displays
In-store analytics turns promotional strategy from guesswork into an actual feedback loop. Run a display in location A for two weeks, measure dwell and conversion, move it to location B, compare. This kind of A/B testing has been standard practice in e-commerce for years, and brick-and-mortar retailers can apply the same logic with the right measurement tools in place.
Track which promotions drive the most inquiry (at the kiosk, from staff, or via phone calls), which displays get customers to stop vs. walk past, and how placement changes affect basket size. Over time, you build a real playbook for what works in your specific store, with your specific customers — which is far more valuable than industry benchmarks alone.
Quick Reminder About Stella
Stella is a human-sized AI robot kiosk and phone receptionist built for businesses across retail, restaurants, medical offices, salons, gyms, and more. She greets customers in-store, promotes deals, answers questions, upsells and cross-sells, and handles phone calls 24/7 — all for $99/month with no upfront hardware costs. If you're trying to improve the customer experience both on the floor and over the phone while generating useful interaction data, she's worth a serious look.
Start Measuring, Then Start Improving
The path from "we think Tuesdays are slow" to "here's exactly what drives conversion in our store" doesn't require a massive budget or an enterprise analytics team. It requires a commitment to measuring consistently, interpreting what the data actually says (not what you hoped it would say), and being willing to test changes rather than assuming you already know what works.
Here's a practical starting point for any business owner ready to take in-store analytics seriously:
- Audit your current measurement tools. What data are you already collecting from your POS, security cameras, or Wi-Fi system? You may have more than you think.
- Identify your top three metrics. Start with conversion rate, peak traffic windows, and one zone-specific dwell measurement. Don't try to boil the ocean.
- Run a four-week baseline. Before changing anything, measure what's happening now. You can't identify improvement without a starting point.
- Make one change at a time. Adjust a display, shift a product category, or change your staffing schedule — then measure the impact before moving on.
- Build the feedback loop. Monthly reviews of your analytics data should become as routine as reviewing your sales reports.
The retailers winning in today's environment aren't necessarily the ones with the biggest budgets — they're the ones making smarter decisions faster. In-store analytics is one of the most practical tools available for doing exactly that. Start measuring, stay curious, and resist the urge to trust your gut over your data. Your gut, while well-meaning, has never actually counted how many people walked past your endcap display without stopping.